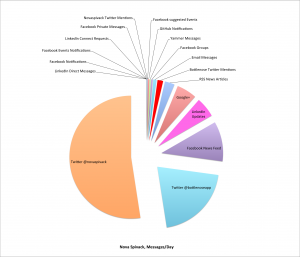
Continuing with the theme I’ve been writing about lately, focused on the growth of the next phase of the Web, what I call “The Stream,” I’ve started to analyze the messages I get on a typical day.
First of all, through all the different channels I use, I now receive approximately 13,000 messages a day. I don’t think I am an extreme case. In fact, anyone who uses Twitter, Facebook, LinkedIn, Google+, email, RSS, and a few Web apps, is probably in the same boat.
Of these, email is no longer the largest stream, but it’s still the most important. However, of 112 email messages received on that day, 46 (41%) were “notifications” from Web apps and Web sites, and these were a lot less important than the remaining messages that were actual communication of one form or another.
The largest streams are Twitter, Facebook and LinkedIn. These streams are comprised of public messages posted by people and sources I follow. In these streams, based on a cursory analysis, it appears messages spool in at a rate that varies on the low side from 1 message every 2 minutes on average (LinkedIn) up to 2 messages per minute on average (Twitter for my personal account where I follow 525 people).
The volume of messages pouring through my social streams is impossible to keep up with. It’s becoming a personal firehose. So, like most people, I have no choice but to ignore 99.99% of them.
However, there are some needles in the haystack that I really would like to find. To solve for that, I use Bottlenose as my dashboard – it surfaces the social messages I really need to pay attention to. It helps me extract more value from my social streams. Fewer calories, more protein. (Disclosure: I’m the CEO of Bottlenose).
I really need something to make sense of all the messages I’m getting. You probably do too. And in with the exponential growth of message volume across all streams, everyone’s going to need this within a year or two. Not just professionals and power-users, but even everyday consumers. In fact, many regular people are already overwhelmed.
Today, while we’re in beta testing, Bottlenose only pulls in Twitter and Facebook. However, where we’re heading is to include ALL the types of streams you see in this diagram above, making Bottlenose a truly “universal dashboard” for the era of the Stream.
I would be very curious to hear what your messaging looks like and if you’re seeing similar levels of overload.
Here’s the raw data for a typical day:
| Stream | Messages/day | Percentage | Notes |
| LinkedIn Direct Messages | 1 | 0.01% | |
| LinkedIn Connect Requests | 2 | 0.01% | |
| Facebook Private Messages | 3 | 0.02% | |
| Facebook Events Notifications | 6 | 0.04% | |
| Facebook Notifications | 7 | 0.05% | |
| Novaspivack Twitter Mentions | 10 | 0.07% | |
| Facebook suggested Events | 15 | 0.11% | |
| GitHub Notifications | 42 | 0.31% | |
| Yammer Messages | 44 | 0.32% | |
| Facebook Groups | 58 | 0.42% | |
| Email Messages | 112 | 0.82% | |
| Bottlenose Twitter Mentions | 200 | 1.46% | |
| RSS News Articles | 350 | 2.55% | |
| Google+ | 720 | 5.24% | .5/min* |
| LinkedIn Updates | 720 | 5.24% | .5/min* |
| Facebook News Feed | 1440 | 10.49% | 1/min* |
| Twitter @bottlenoseapp | 2800 | 20.39% | 2/min** |
| Twitter @novaspivack | 7200 | 52.44% | (5/min)** |
| Total | 13,730 |
Notes
 *  Estimated average based on counting; does not include comments on messages
 ** Estimated average based on counting
